6 Data quality
Bölüm anahatları
-
processing time: 13 minutes, 47 seconds
processing time (without video): 10 minutes, 35 seconds-
6.2 Data and quality – Which criteria are relevant?
Data quality criteria
Perhaps you want to conduct a survey on the risk of car theft based on place of residence, i.e. postcodes. Or you want to use a questionnaire to find out whether there is a connection between academic success and school-leaving grades. In any case, you collect data that you evaluate. To do this, the following dimensions of data quality must be fulfilled, whereby not all dimensions play a role at the same time, depending on the goal and purpose of a data collection.
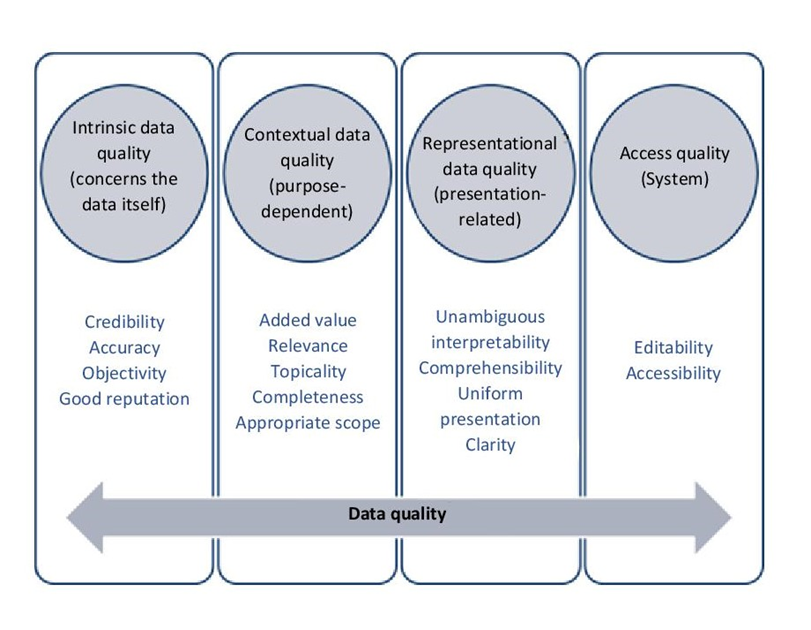
Fig. 6.1: Overview of data quality criteria, source: FOKUS
These criteria go back to Richard Wang and Diane Strong (1996). They describe high-quality data as data that is considered appropriate by the data users (including yourself) both now and in the future. In order for research data to be interesting and re-used years later, the data must be described as thoroughly as possible. Therefore, it is important to document the data well and include metadata (see Chapter 4) as well as any created and necessary research software to open and view the files.
An example – data quality criteria and their implementation
Using the example of the creation of a table with company address data, the criteria of data quality are exemplified in the following. With the help of the overview, it should be possible to gain quick insights into the distribution of customers according to federal states and to be able to send invoices specifically to the right contact persons. The table contains the following features:
- Internal customer number
- Company name
- Street
- House number
- Postcode
- Location
- State
- Last name contact person
- First name contact person
- Telephone number
The goal of every scientific enterprise is the generation of knowledge. In a process, this is gained from information, which in turn is derived from data.
In order for this to happen, it is important to clearly name the columns in this example. Only then, it becomes clear that a certain sequence of numbers and symbols (data) stand for a certain fact (information). Even if the assignment is known to the researchers at the time of data collection, this metadata is still necessary to be able to understand the data collection in the future. Likewise, of course, the data itself must also meet quality criteria.
The criteria in detail
Intrinsic data quality:
- Credibility: For this, the data must be trustworthy and reliable. For our example project, you can increase the credibility of your data by explaining where the data comes from.
- Accuracy: Correctness includes the correct recording of the data. In our example, the name “Westphalia” would be wrong, because the correct name is North Rhine-Westphalia. If the customer actually comes from Saarland, the name North Rhine-Westphalia would also be incorrect.
- Objectivity: Your data is objective if it does not contain any evaluations. In this example, an addition such as “complicated person” to the first or last name of the contact person would violate the criterion of objectivity.
- Good reputation: This is about the reputation of your data source. For example, data you get from other research projects or professional information portals may be considered more reliable than data from a data broker or data collected through a general internet search.
Contextual data quality:
- Added value: The information offers added value if it can be used to fulfil the intended tasks. In this example, this could be a query on all companies in a certain federal state.
- Relevance: Data is relevant if it provides the user with necessary information. For example, customer data from Switzerland would have added value in terms of information, but would not be relevant for the distribution of companies across the German federal states.
- Topicality: Your data is up to date if it reflects a corresponding status in a timely manner. In this example, a four-digit postcode would not be up to date because Germany switched to a five-digit system in 1993. Information about the current status can be obtained, for example, from the metadata supplied, documentation materials or date information in the document itself (date: ..____).
- Completeness: Your data is complete if no information is missing. If, for example, only 10 of the 16 federal states were included in the customer data table or if there were no address data for some of the customers, this would mean a loss of completeness.
- Adequate scope: The data is available in an adequate scope if the requirements can be met with the amount of data available. In our example, this means that for the goal of sending invoices, address data and information on who the responsible contact person is are sufficient, and telephone numbers are not necessary for this case.
Representative data quality:
-
Unambiguous interpretability: Data is unambiguously interpretable if it is understood in the same way by everyone who works with it.
-
Comprehensibility: Your data is comprehensible if it can be understood by the data users and used for their purposes. For our goal of creating a client database, this means that the listed contact persons are listed with their first and last names and not with descriptions like “the woman on the third floor with the brown hair”.
-
Uniform presentation: If the data is presented in the same way throughout, it is uniform. In our case, this means deciding for the indication of the postcode, for example, whether the sequence of digits is preceded by a “D-“.
-
Clarity: The clarity of data is ensured when it is presented in a way that is easy to grasp. In our example, this means setting up different columns for the various details so that the details can be output in a content-separated and non-condensed form. For example, we would like to have an address information according to the following pattern
Ms Iris Mueller Blaue Strasse 20 D-34567 Gruenstadtand not:MrsIrisMuellerBlaueStrasse20D-34567Gruenstadt
Access quality:
- Workability: This criterion is fulfilled if your data can be easily modified for the respective purposes of use. For our example database, this is the case if the names of the responsible contact persons can be edited. In this way, possible changes can be implemented promptly. If the table was available in PDF, for example, it would not be possible to edit it.
- Accessibility: In our example case, the persons concerned can directly access the data and generate an address, and they do not have to call somebody to ask for the address data.
-
An example – The result
And this is what the result finally looks like. By taking a closer look, however, you might realise that the data quality dimensions were not implemented without errors in the result. Can you find the mistakes?
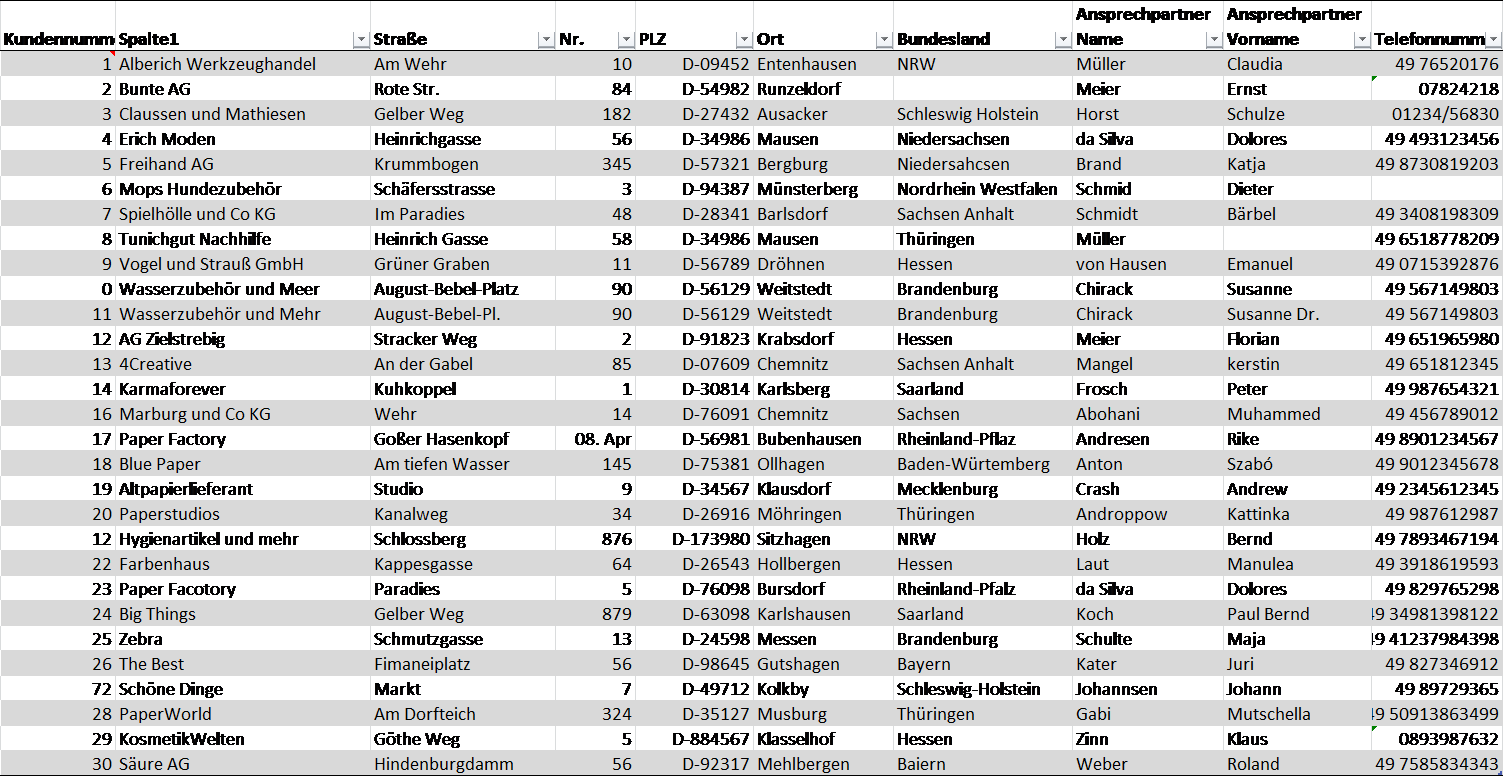
Fig. 6.2: Example table on data quality
For an exact error analysis, please watch the following video:
-
-